

Performance report
Performance is the working report — the one you open to decide what to fix. It concentrates the actionable AI views: trends over time, the drivers ranked by wasted volume, where knowledge gaps cluster, and how your articles perform. Almost everything here is AI-computed and carries an AI badge. If you only learn to use one report, learn this one; the whole How-to series starts here.
All three global filters apply, with a per-chart Daily / Weekly / Monthly control.
Performance Overview
The KPI row at the top: Resolution (%, AI), Resolved (the raw resolved / engaged count, of engaged conversations, with a progress bar), and Knowledge Gap rate (%, AI).
Drill-down: the Resolution and Resolved cards open the resolved conversations; the Knowledge Gap card opens the ones where the bot lacked information. Left early conversations are not counted in Resolution or Resolved.

Trends
How are AI metrics evolving?
Two charts: AI Resolution over time (bars, 0–100%) and Knowledge Gap rate over time (line, 0–50%). Both AI. This is where you confirm a fix worked — after you change something, the topic's line here is what should move over the following weeks.
Unresolved Drivers
Which topics have the highest unresolved impact?
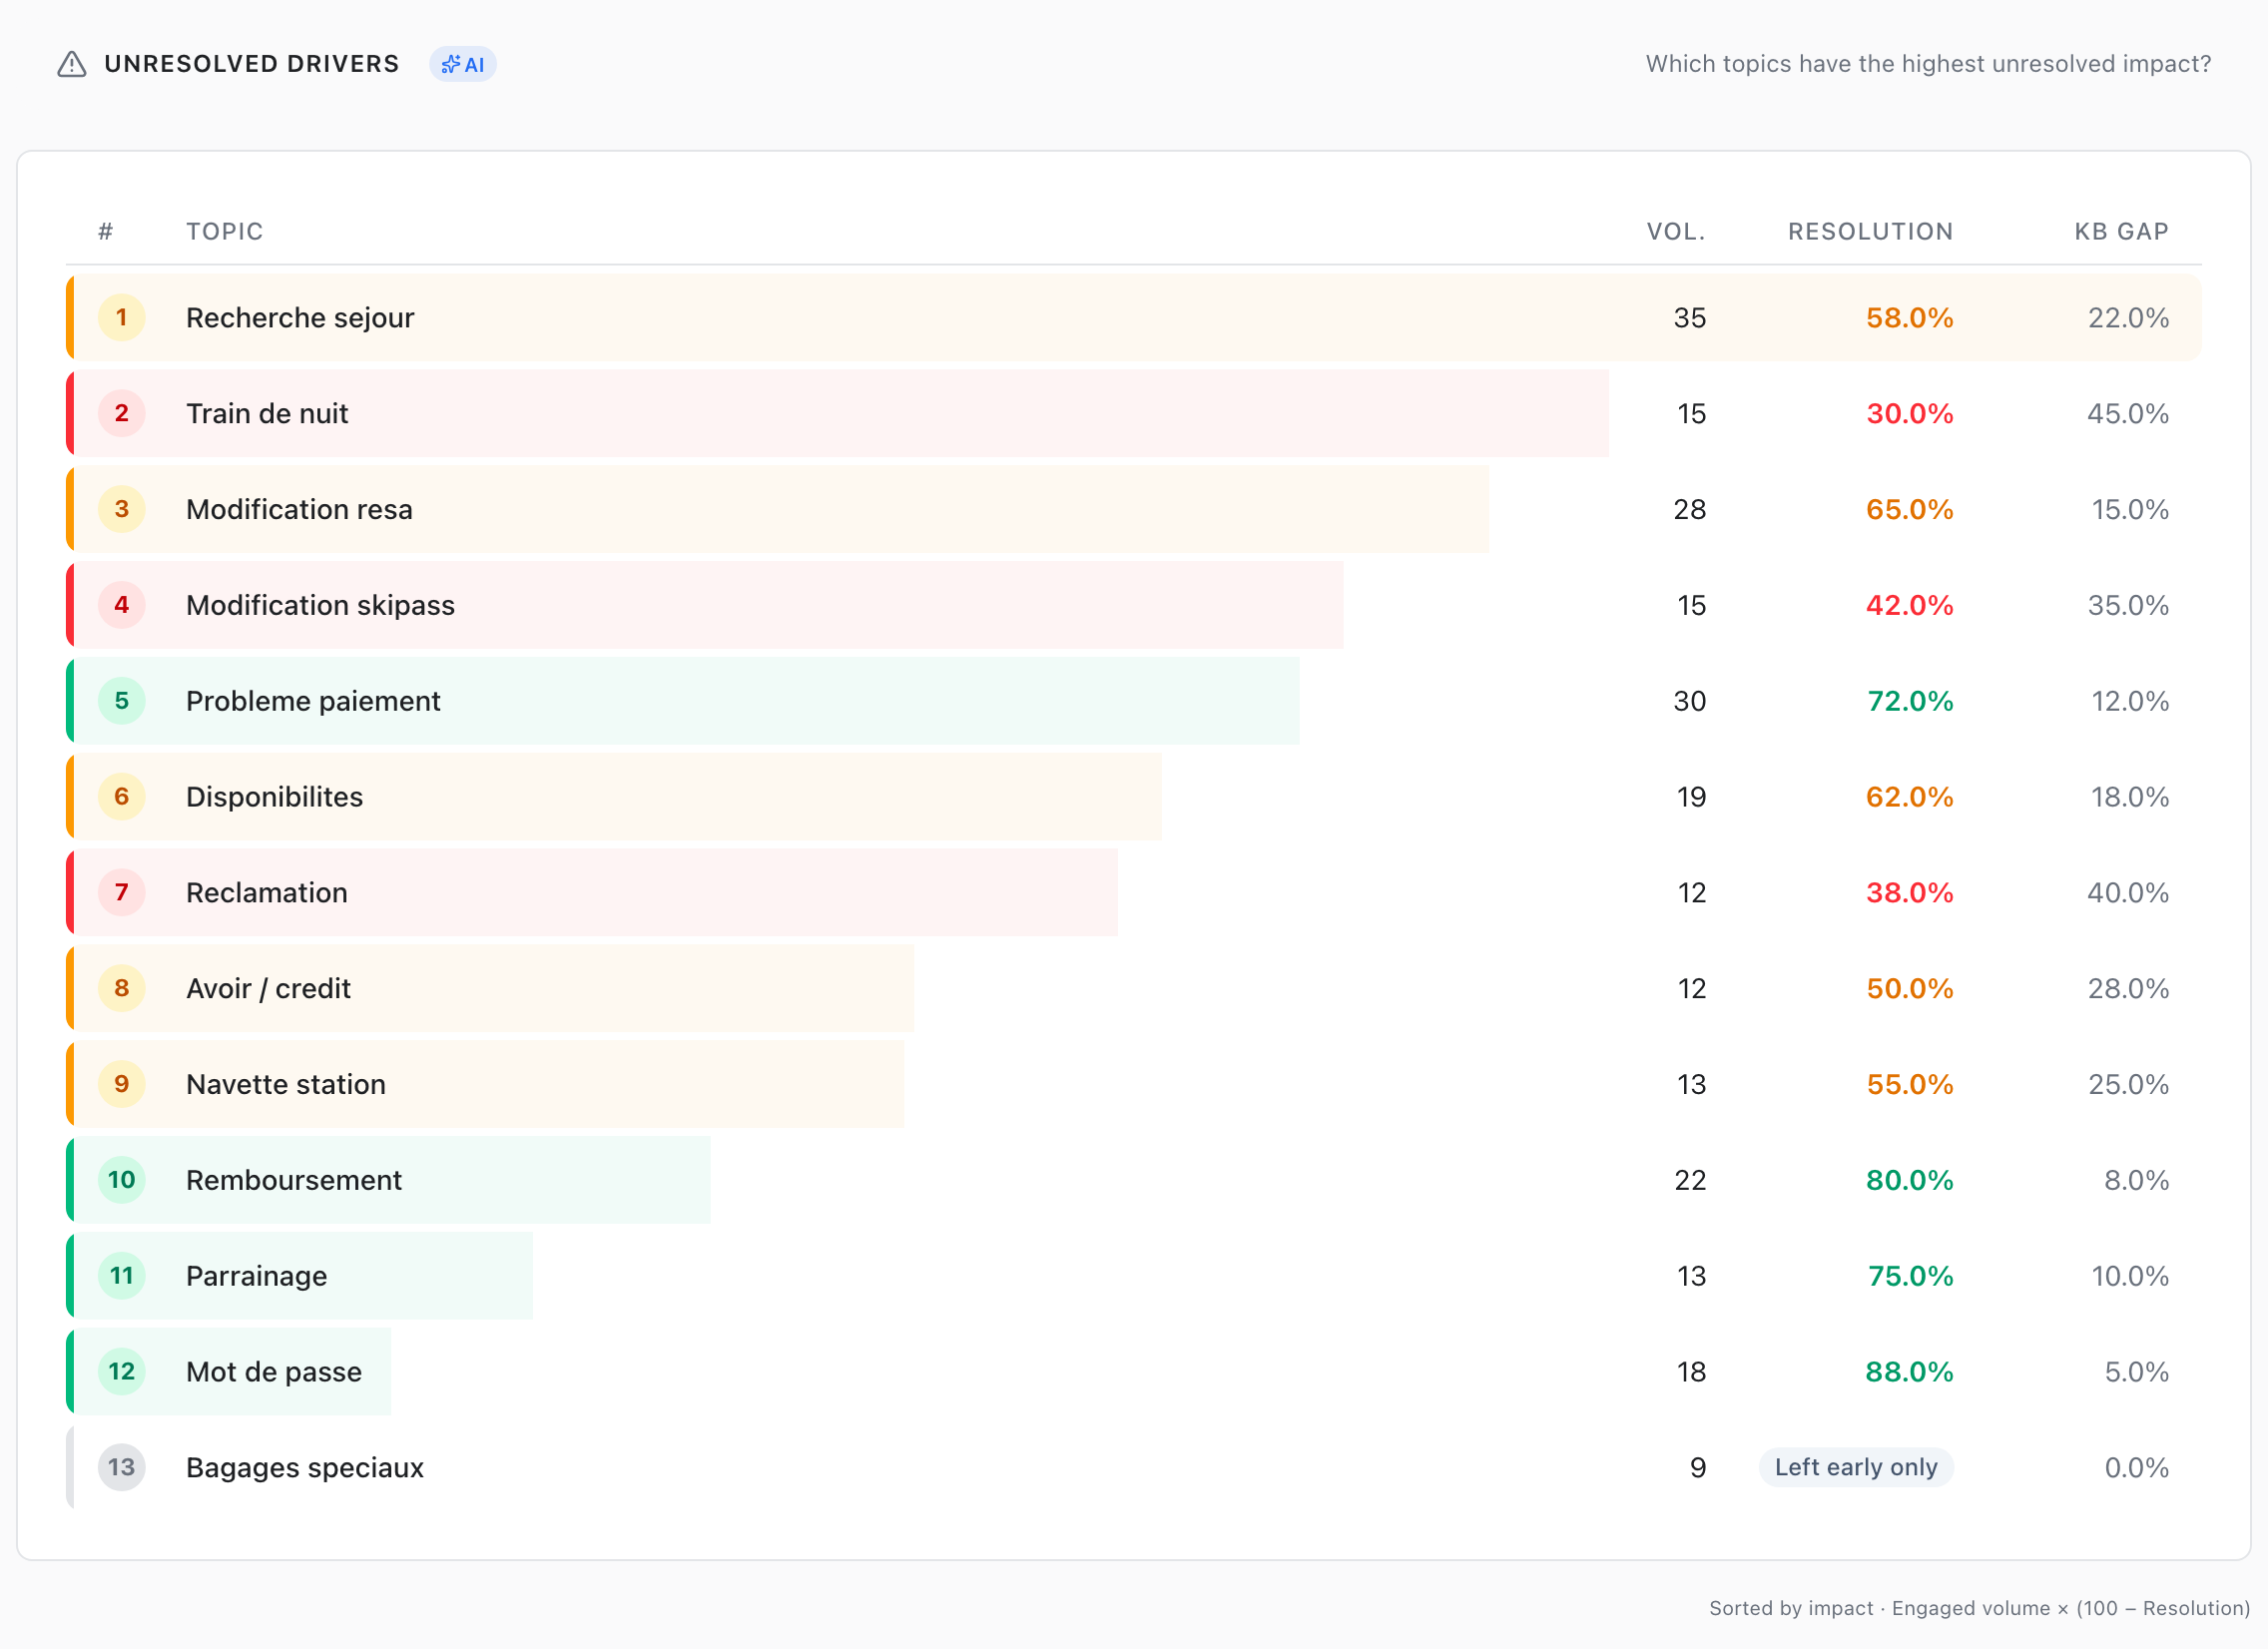
The single most important table in Analytics. Columns: # / Topic / Vol. / Resolution / KB Gap, sorted by impact = Engaged volume × (100 − Resolution). Engaged volume counts the topic's Resolved and Unresolved conversations. A topic made only of Left early conversations shows Left early only and sits at the bottom of the table.
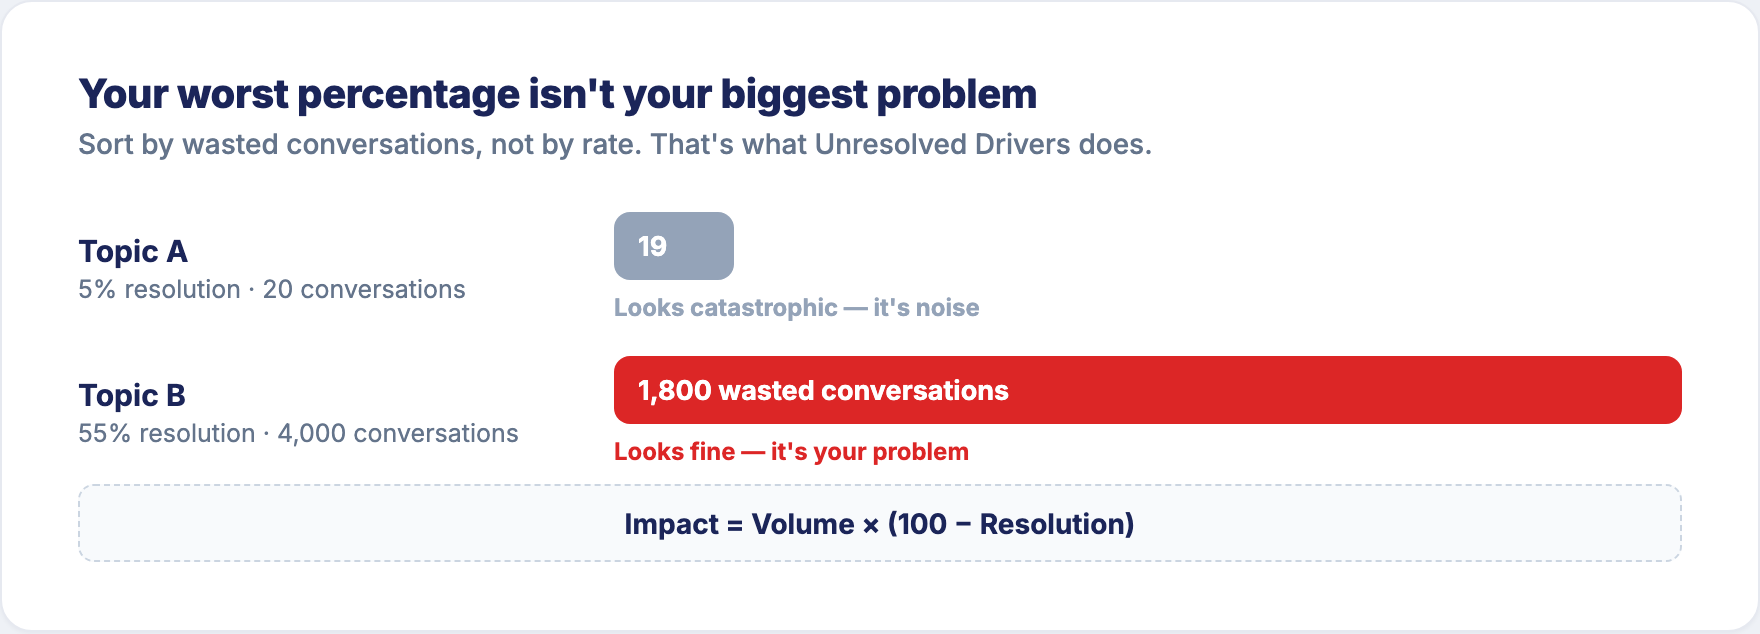
That sort is the whole trick: it ranks by wasted conversations, not by percentage. A topic at 55% resolution over 4,000 conversations outranks a topic at 5% over 20 — because it's worth 1,800 failures against 19. It points you at your most expensive topic, not your worst-looking one. Carries the AI badge.
Drill-down: click a row to open that topic's unresolved conversations, pre-filtered. That click is step 2 of How to improve your resolution.
Knowledge Gaps by Topic
Which topics have the largest knowledge gaps?
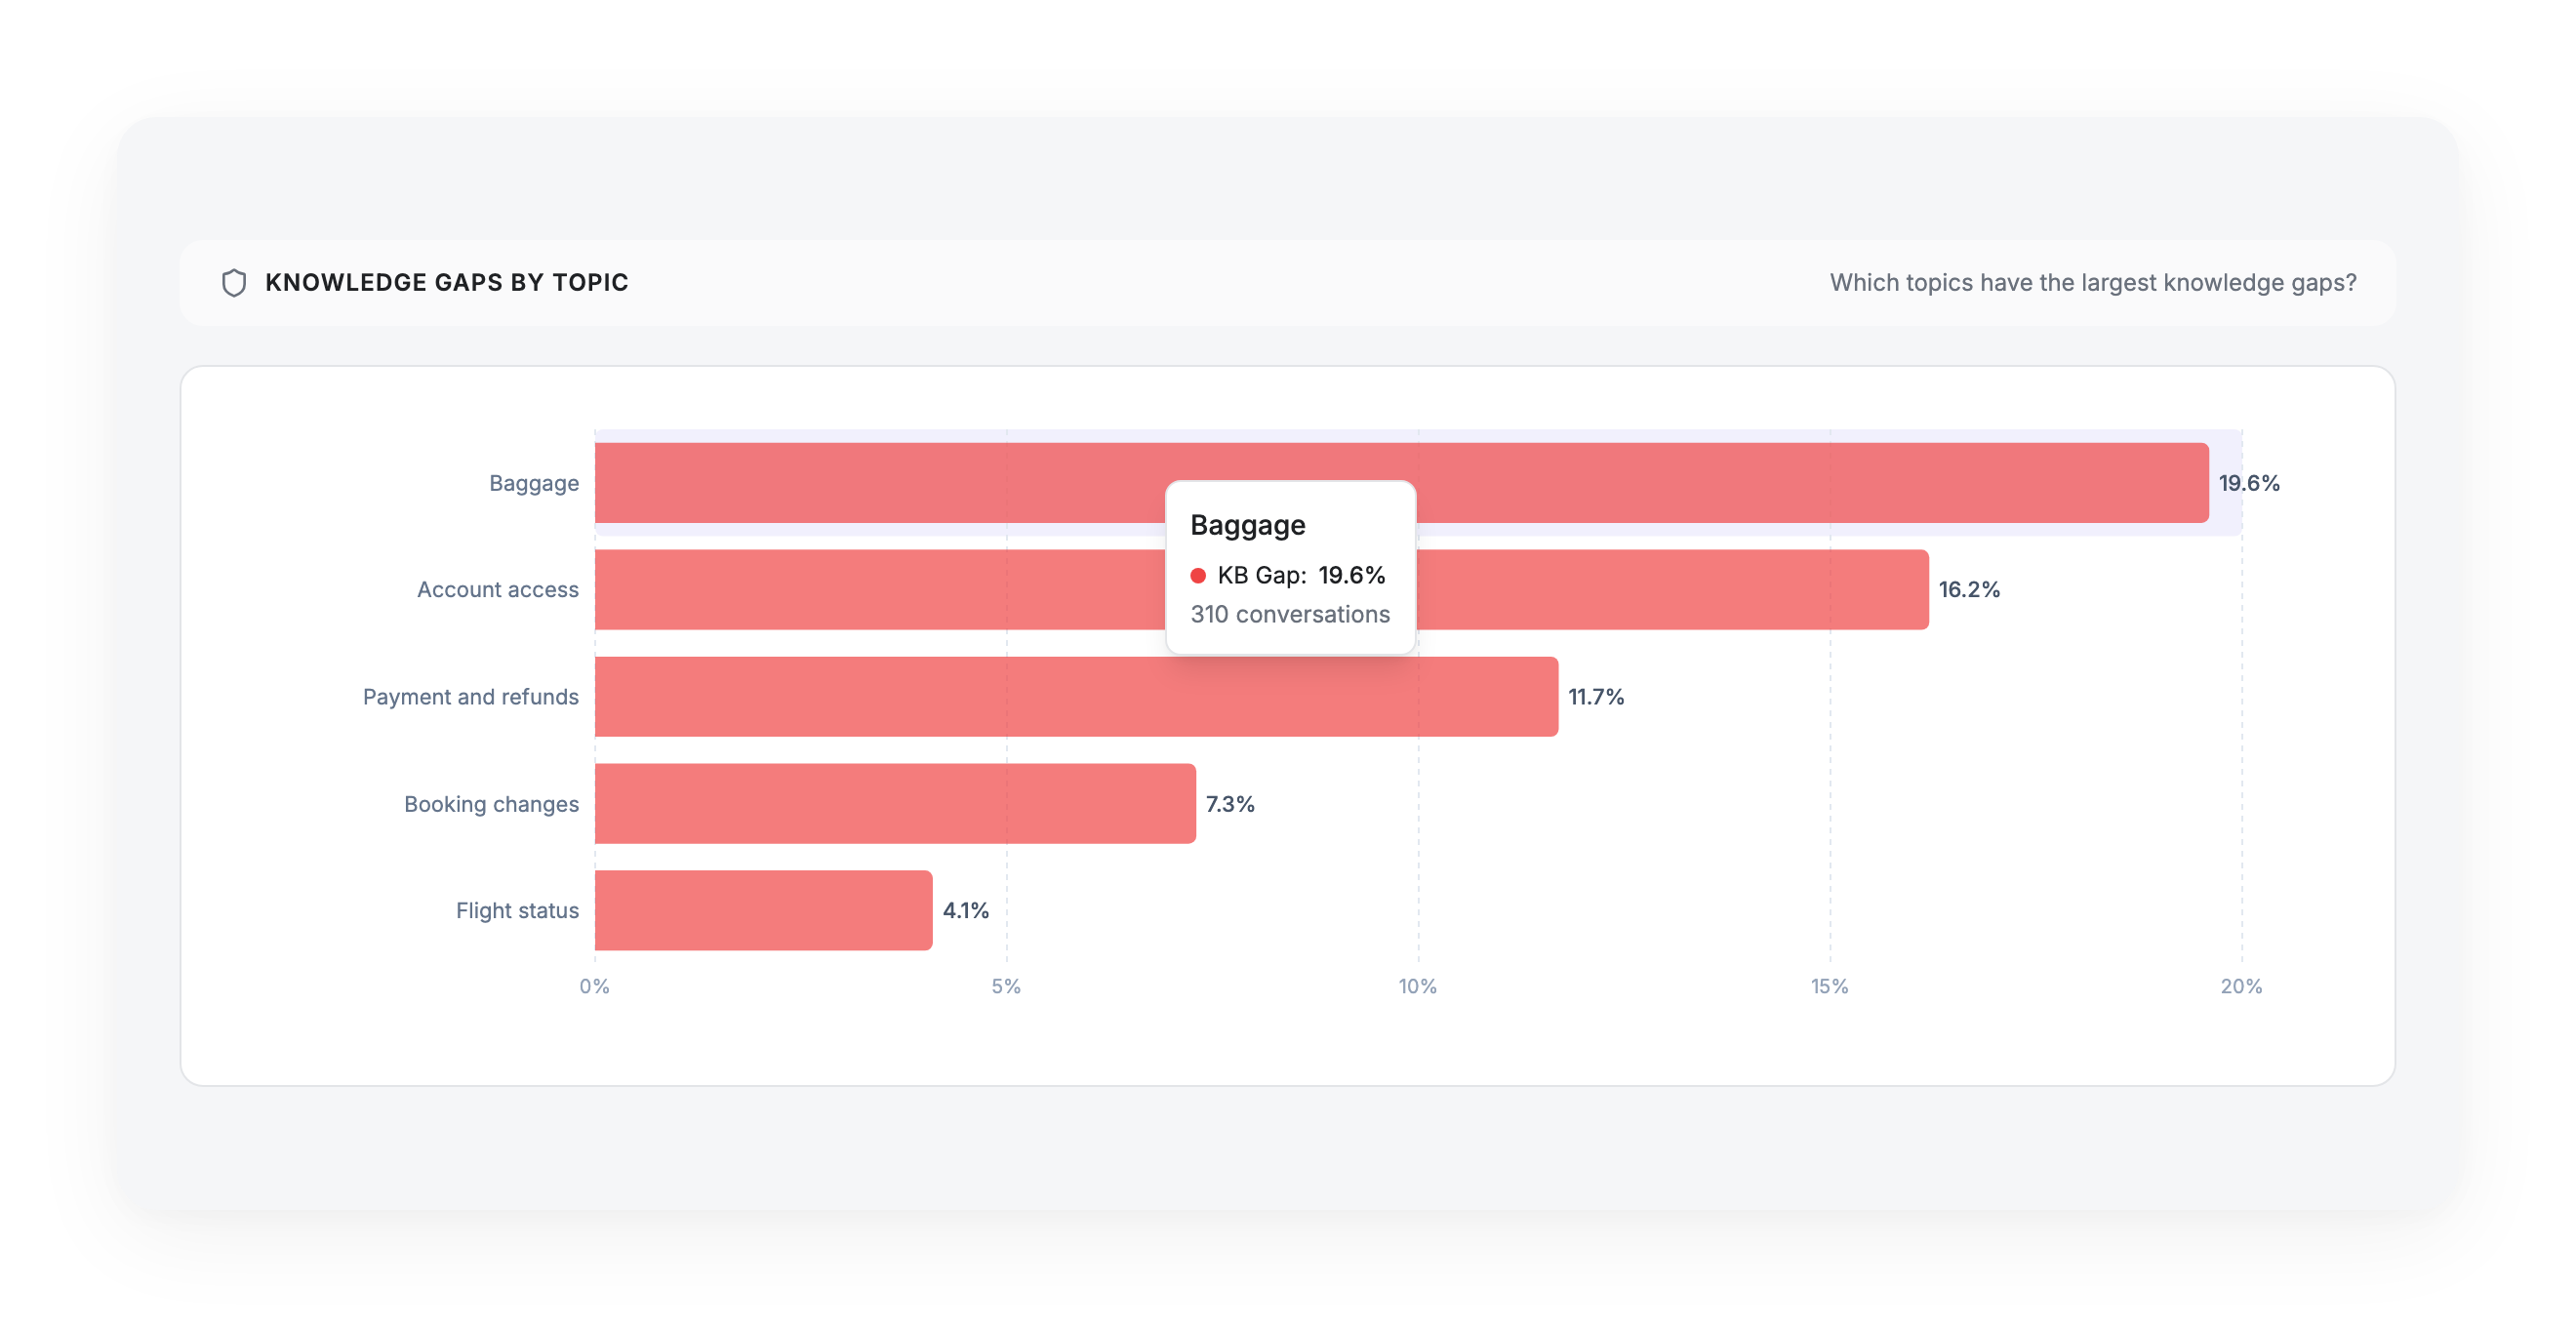
A horizontal bar chart of the top topics by knowledge-gap rate (the "Other" bucket is filtered out so it doesn't drown the real subjects). This is where you see which topic is bleeding the most missing information.
Drill-down: click a bar to open that topic's conversations and read what people were actually asking — the fifteen minutes that produces your Knowledge Base to-do list. Full workflow: How to reduce your knowledge gaps.
Article Performance
How well are knowledge base articles performing?
A sortable table in two column groups:
- Message-level: Article, Triggers, CSAT
- Conversation-level: Resolution, CX Score, KB Gap
It tells you how your existing Knowledge Base articles are doing. A low-performing article on a high-gap topic usually means the content exists but is unclear, mistitled, or aimed at the wrong question — a content quality problem, not a coverage one. Read it alongside Knowledge Gaps by Topic: one shows what's missing, the other shows what's underperforming.
Updated 16 days ago