
Overview
Track key performance metrics like deflection, handover, recognition, and satisfaction — all in one central dashboard
What you will find
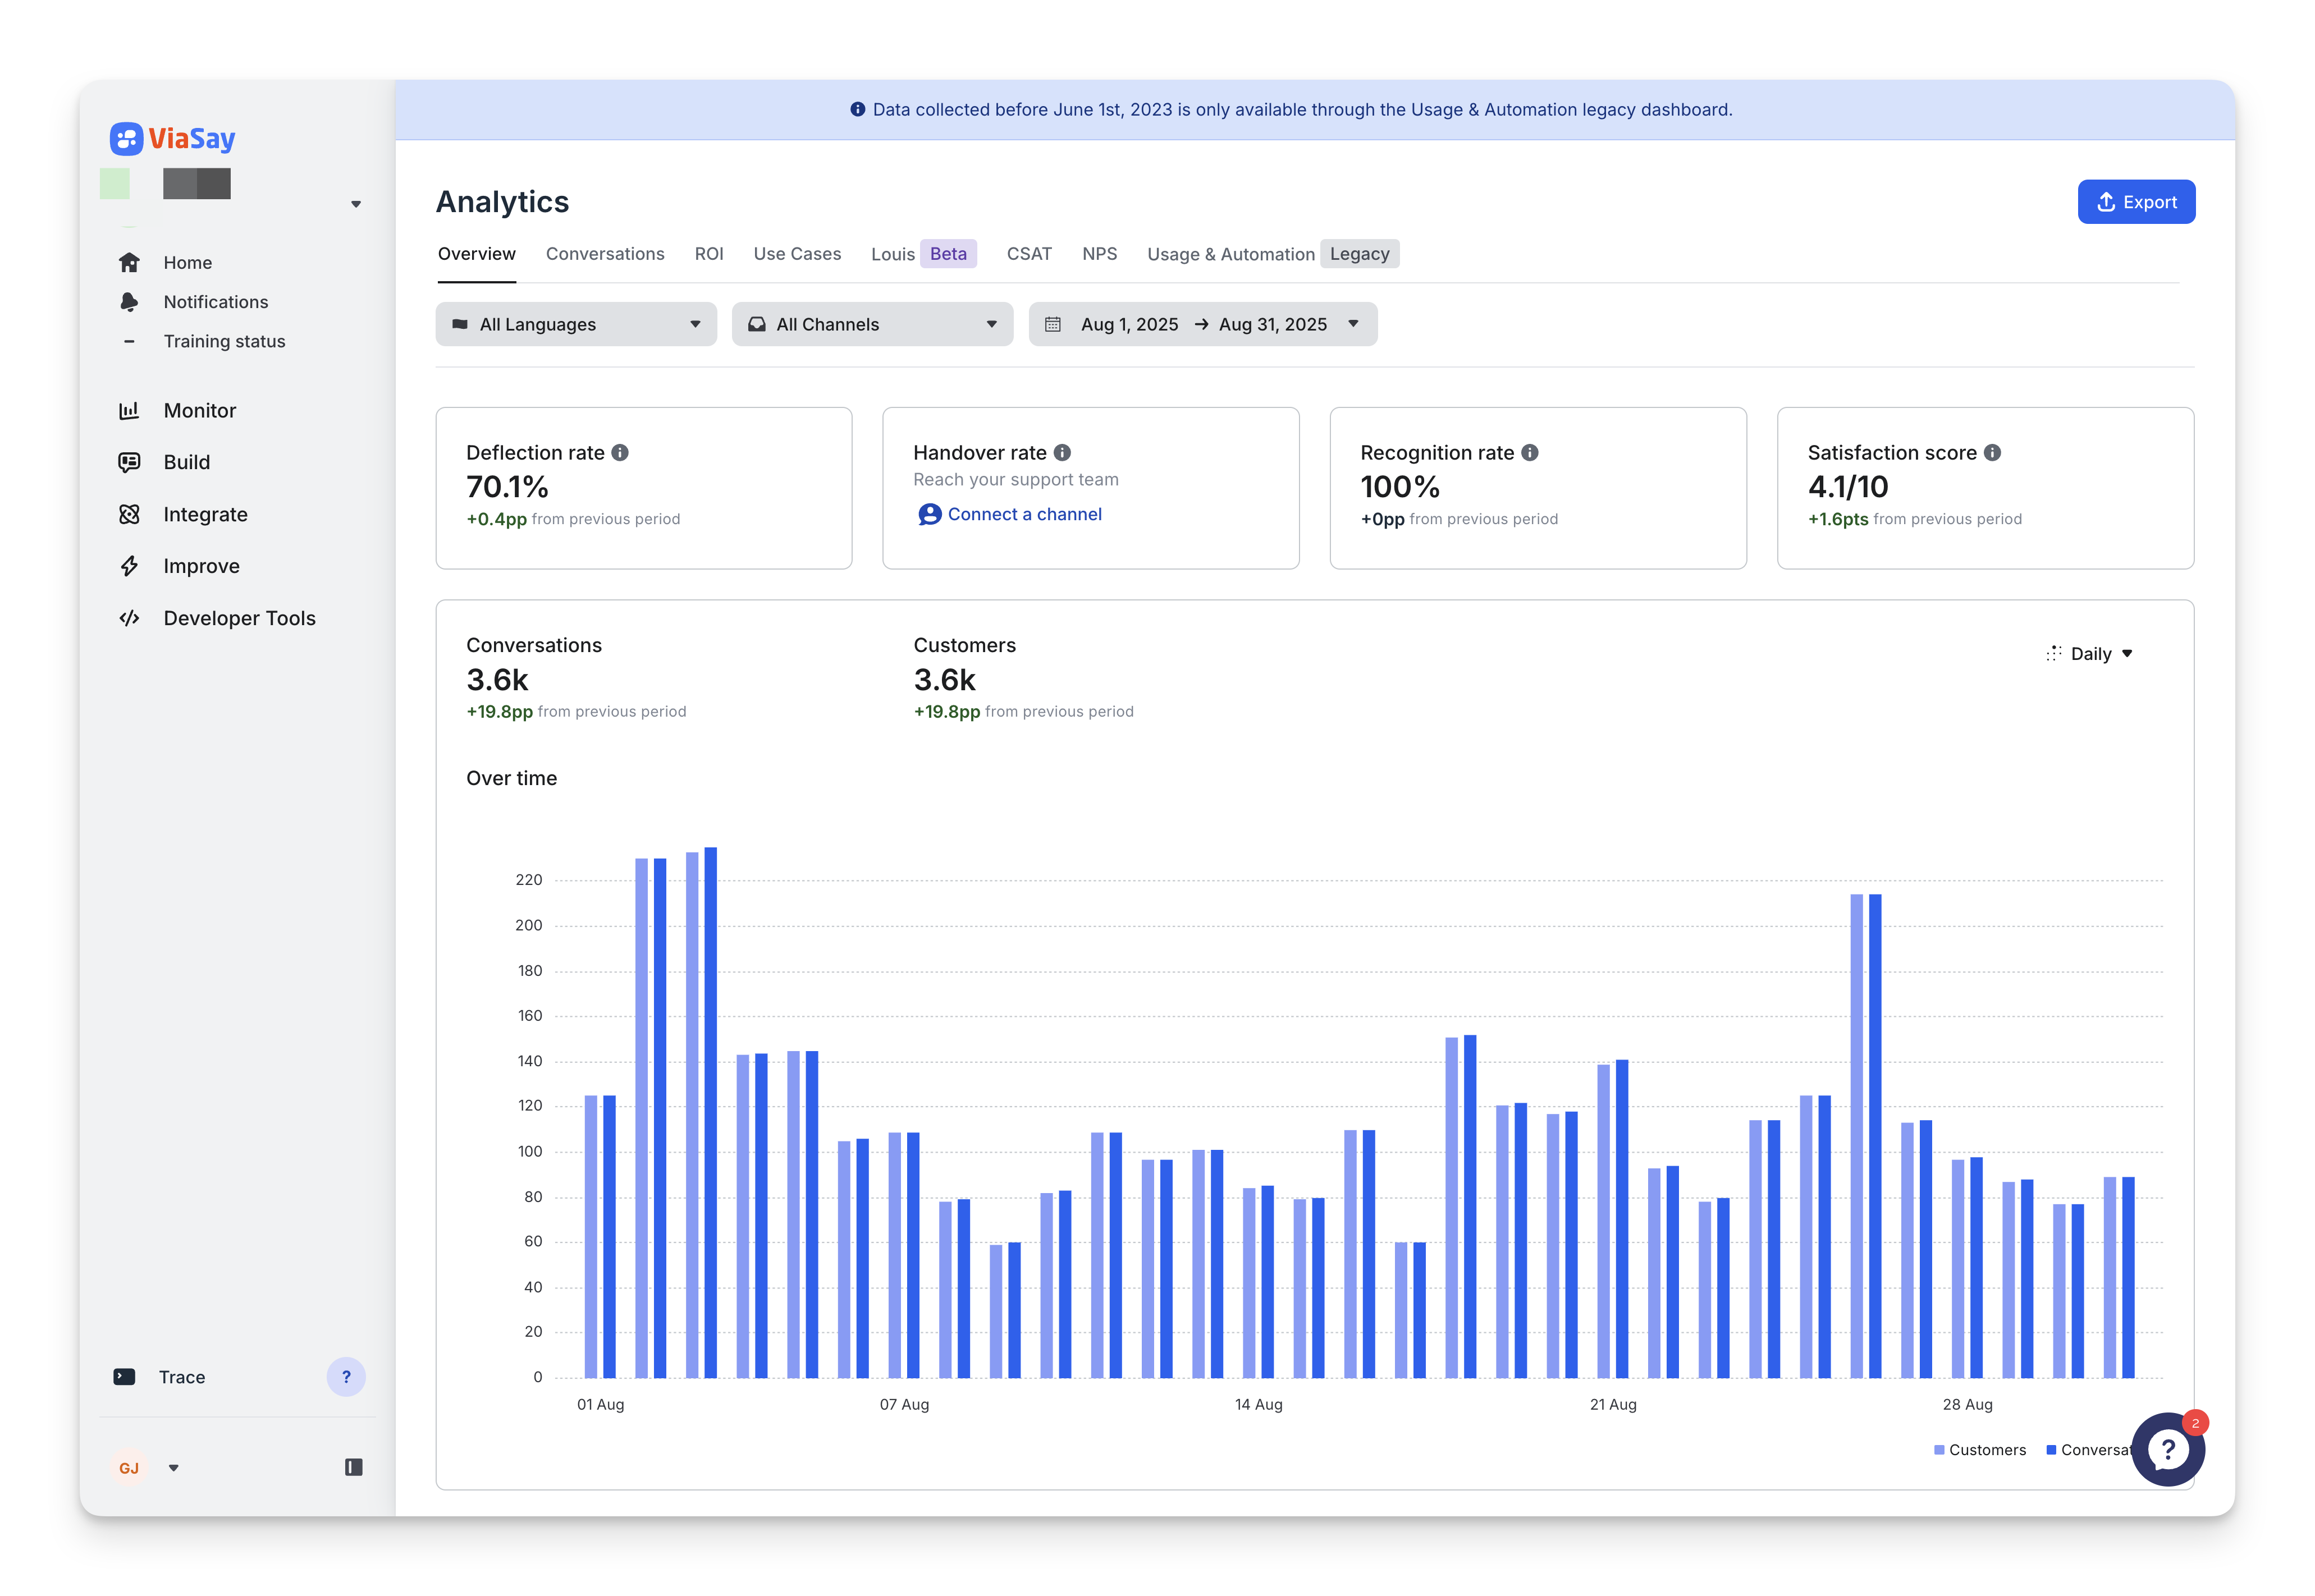
The Overview gives you a snapshot of your chatbot’s performance with 4 key metrics:
| Metric | What It Means | How to Read It |
|---|---|---|
| 🟢 Deflection Rate | The percentage of conversations that were resolved by the bot alone — with no handover to a human. | A high deflection rate means your bot is doing a good job answering questions and reducing support load. |
| 🔁 Handover Rate | The percentage of conversations that needed to be transferred to a live agent. | A high handover rate might indicate that users are asking questions the bot can’t handle. |
| 🎯 Recognition Rate | The percentage of times the bot correctly identified the user’s intent and triggered a relevant use case. | A high recognition rate shows the bot is accurately understanding user inputs. |
| ⭐ Satisfaction Score (CSAT) | The percentage of users who gave a thumbs-up after a bot answer. | A high CSAT score indicates that users are satisfied with the bot’s responses. |
Each metric includes a comparison with the previous period.
Understanding Progress Types
Each metric in the Analytics dashboard compares your selected time period to the previous equivalent period (e.g., last 14 days vs. the 14 days before that). Progress is displayed in three different formats depending on the type of data:
| Type of Metric | What It Is | How the Progress Is Shown | What It Means |
|---|---|---|---|
| Absolute Number | A total count (e.g., number of conversations, number of users) | % (percent) | Shows how much bigger or smaller the number is compared to before. Example: You had 1,000 conversations last time, and 1,500 now → That’s +50% more. |
| Rate | A percentage based on a formula (e.g., 100 out of 500 conversations were handed over = 20%) | pp (percentage points) | Shows how much that percentage changed. Example: If your handover rate was 20% and now it’s 30% → That’s +10pp, not +50%. |
| Score | A rating out of 10 (like CSAT or NPS) | pt (points) | Shows how much that percentage changed. Example: If your handover rate was 20% and now it’s 30% → That’s +10pp, not +50%. |
Percentage points (pp) and points (pt) are used instead of percentage (%) to avoid confusion when comparing already calculated percentages or scores.