
Use cases
See which use cases are triggered most often, how effective they are, and how users respond to them
This dashboard helps you understand how your chatbot is used, which use cases are most effective, and where users might be struggling.
By default, it shows data from the last two full weeks (excluding the current one).
Key Metrics
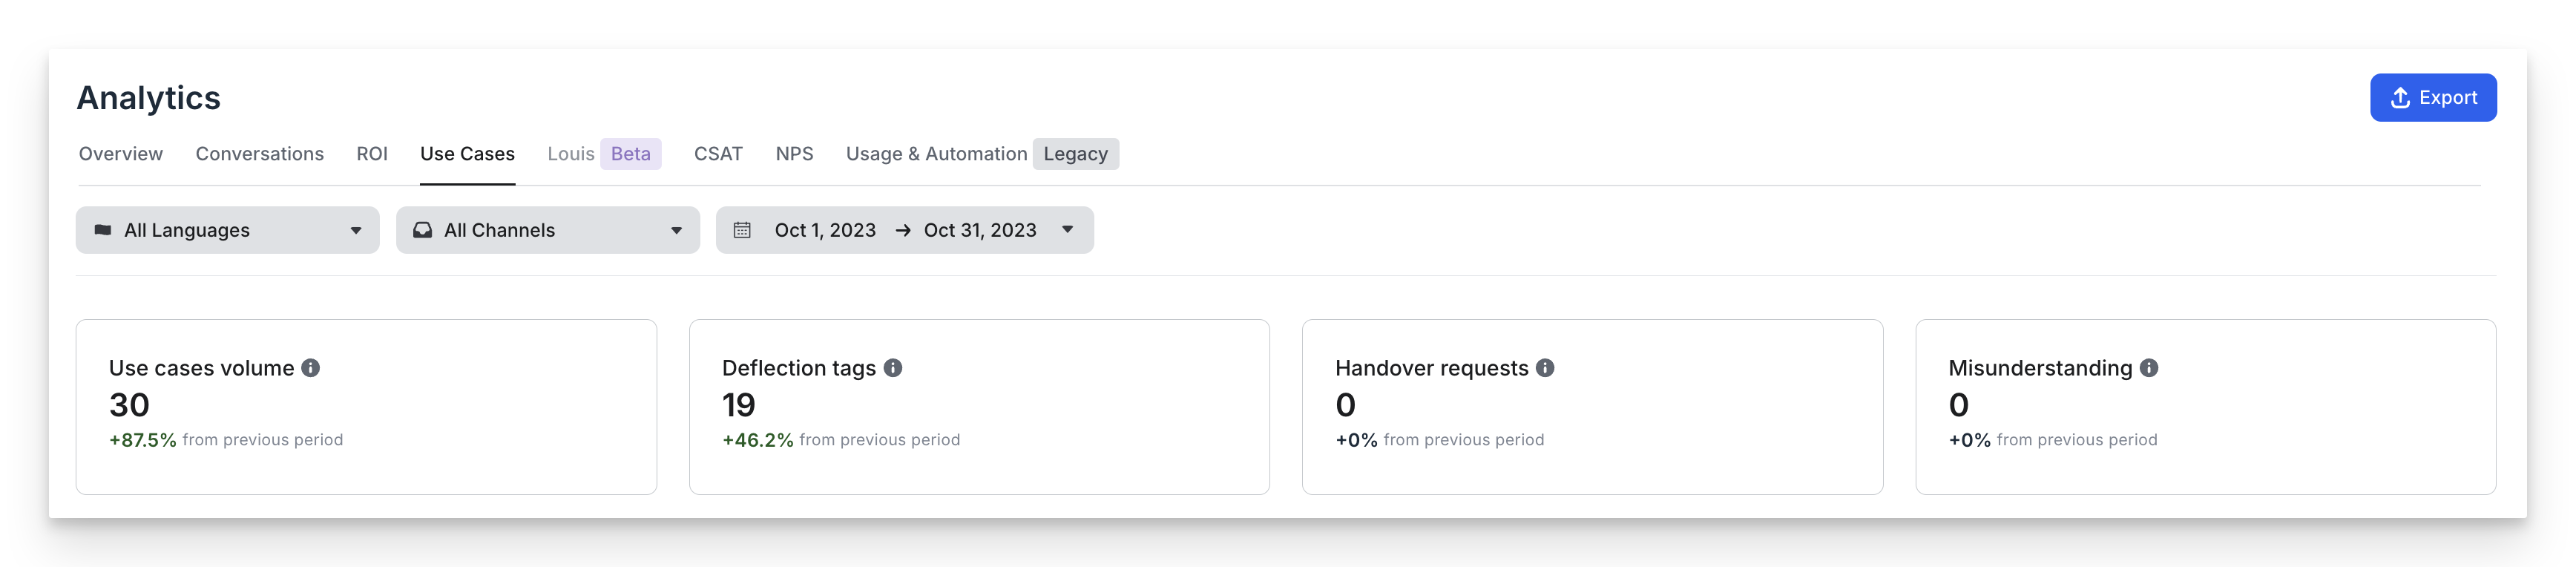
You will see 4 important numbers at a glance:
- Use Cases Volume
Total number of use cases triggered during conversations.
Example: A conversation triggers 6 use cases (1 of them twice) → we count 5 unique triggers. - Deflection Tags
Total number of deflection tags reached. These indicate where the bot helped without needing a human. - Handover Requests
Total number of times the bot had to escalate to a human agent. - Misunderstandings
Total number of times the bot didn’t understand and triggered a misunderstanding use case.
Compare to Previous Period and track Over Tim
For each metric, you can see if it went up or down compared to the previous period (same length, just before the current one). You can also view how these events changed over days, weeks, or months.
Use Case Performance
🔝 Use Cases by Volume
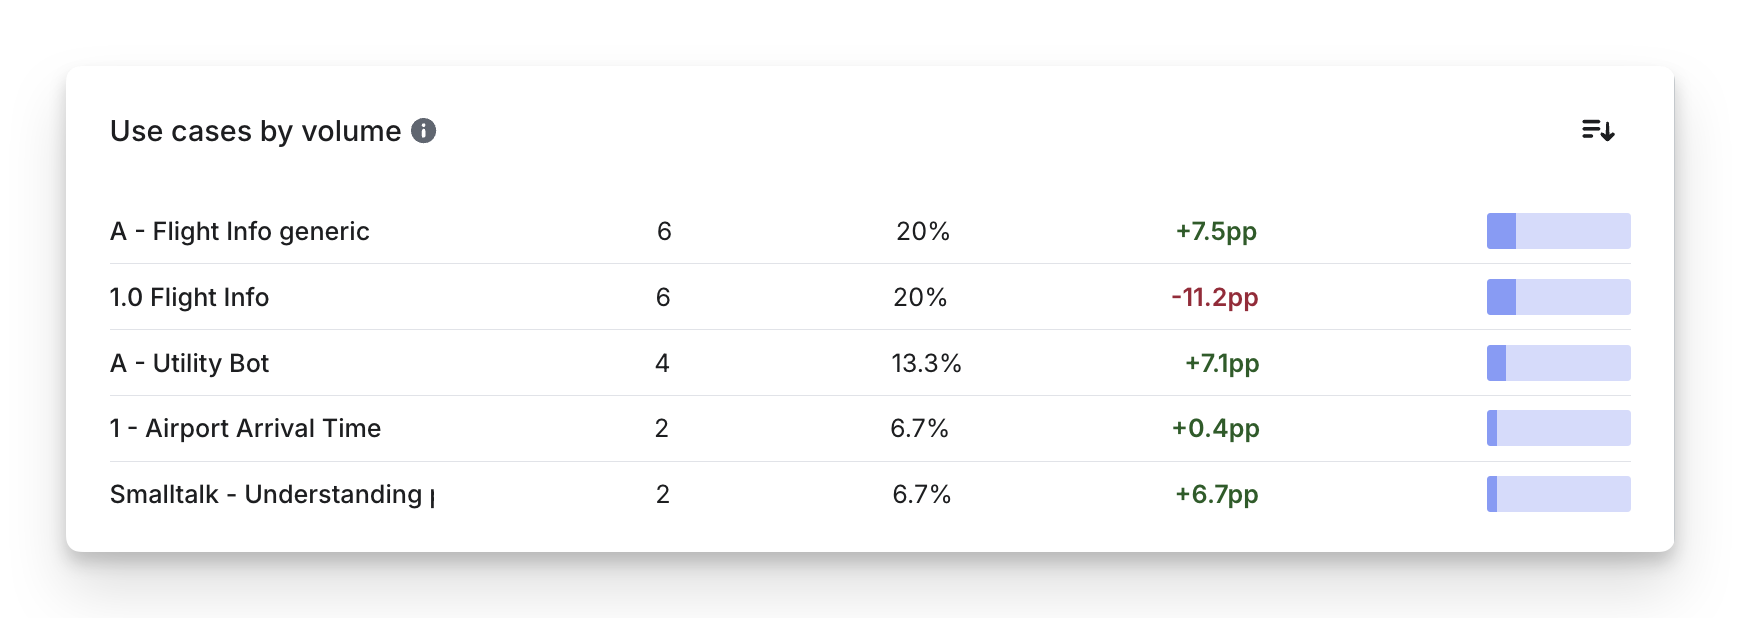
This shows which use cases are triggered the most.
- Volume: How many times a use case was triggered.
- Rate: What % it represents out of all use case triggers.
- Progress (pp): Change compared to the previous period.
Example: 28.5% now vs. 30.6% before → progress = –2.1pp.
😊 Use Cases by Satisfaction Score (CSAT)
Use cases are ranked by how satisfied users were with them.
- Satisfaction Score: Based on CSAT feedback.
Score = (positive ratings × 10) ÷ (positive + negative ratings) - Progress (pts): Change in score compared to the previous period.
Example: 10/10 now vs. 2.5/10 before → progress = +7.5pts
🛡️ Use Cases by Deflection
Which use cases helped resolve issues without human help?
- Deflection Volume: Number of deflection tags reached through this use case.
- Rate: % of total deflection tags this use case represents.
- Progress (pp): Change compared to the previous period.
👥 Use Cases by Handover
Which use cases ended up needing a human?
- Handover Volume: Number of handover requests from this use case.
- Rate: % of total handovers this use case represents.
- Progress (pp): Change over time.
Categories Performance
Categories are folders that group your use cases. This section shows how each group performs.
🔢 Categories by Volume
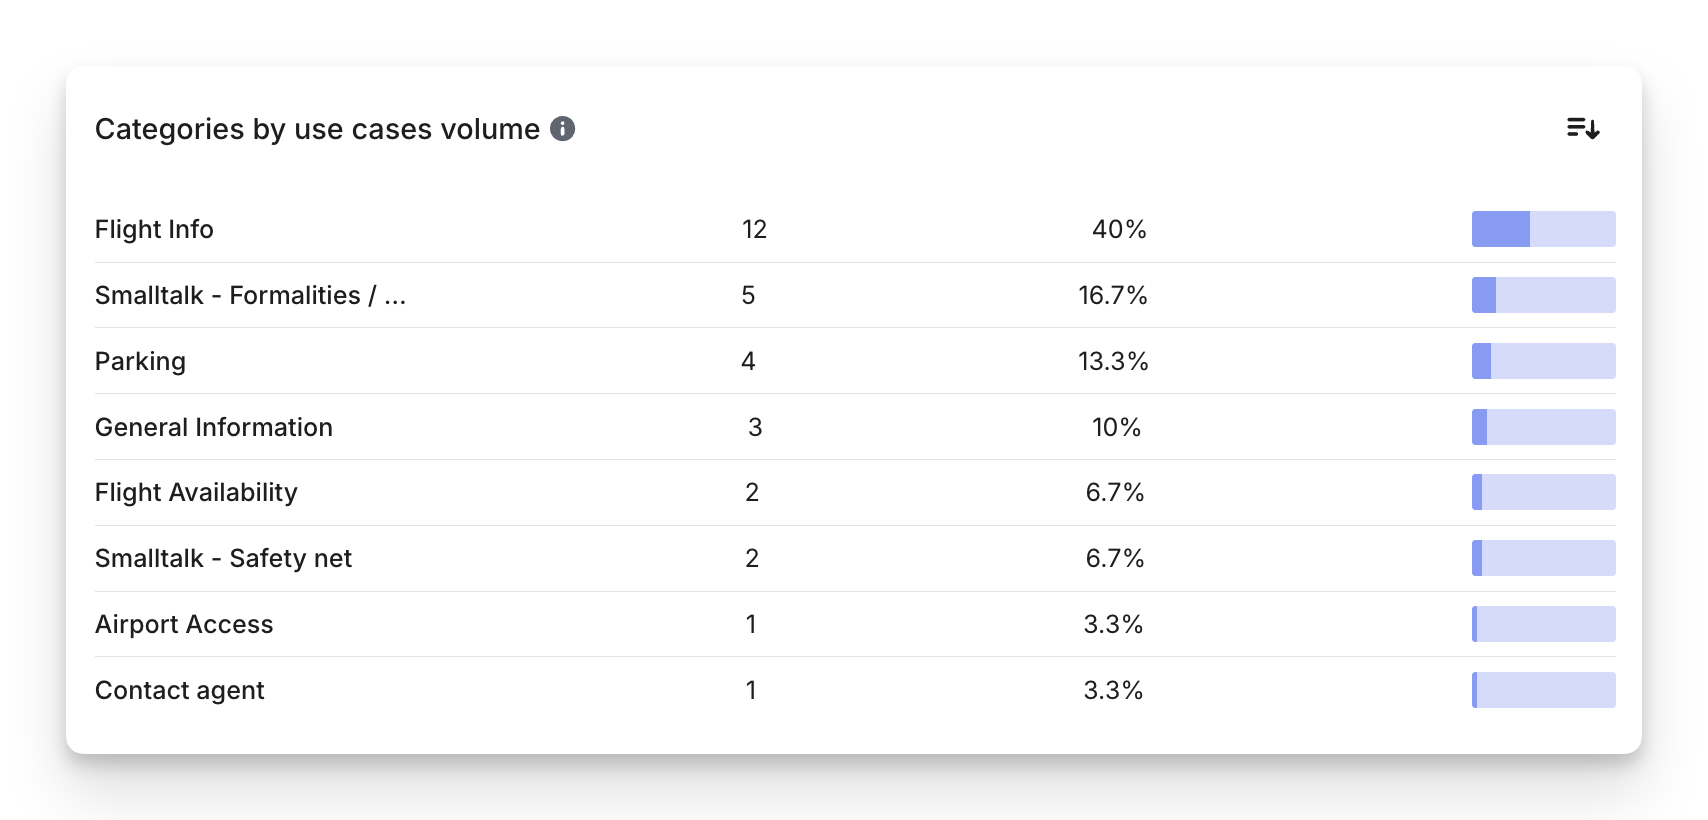
Which categories contain the most-used use cases?
- Volume: Total use case triggers in this category.
- Rate: % of all use case triggers this category represents.
📊 Categories Breakdown
Compare each category's performance based on:
- Volume Share: % of total triggers from this category.
- Implementation Share: % of total use cases built that belong to this category.
- Satisfaction Score: Based on all CSAT ratings in that category.
Example: 80 positives + 20 negatives → Score = 8.0/10