

AI Quality Monitoring
Every conversation that ends is now read and analysed by an AI evaluator. This is the home page for that feature: what it measures, how it works, and where each number lives. Each metric and each screen then has its own page in this section.
New here? Read in this order
- This page — the frame and how the evaluation works.
- The metric you care about: AI Resolution, CX Score, Knowledge Gaps, Topics.
- When you want to act on it: How to improve your resolution.
And before you look at your first number: it will be lower than you expect, and that is normal. It is not a verdict on the work you have already done. See measure first, improve second below.
The problem it solves
Until now, you could only measure quality on the conversations where the user voted.
That vote — the thumbs up / thumbs down that produces your CSAT — is given by a small minority of users. Everyone else leaves without saying anything. A user who got a perfect answer and a user who gave up in frustration look exactly the same in your data: one conversation, no vote, no signal.
So the honest summary of the old situation is: you measured a few percent of your conversations and hoped the rest looked similar.
In the dashboard, your bot is called Louis — that's the name you'll see on the Louis section and on the message author.
What changed
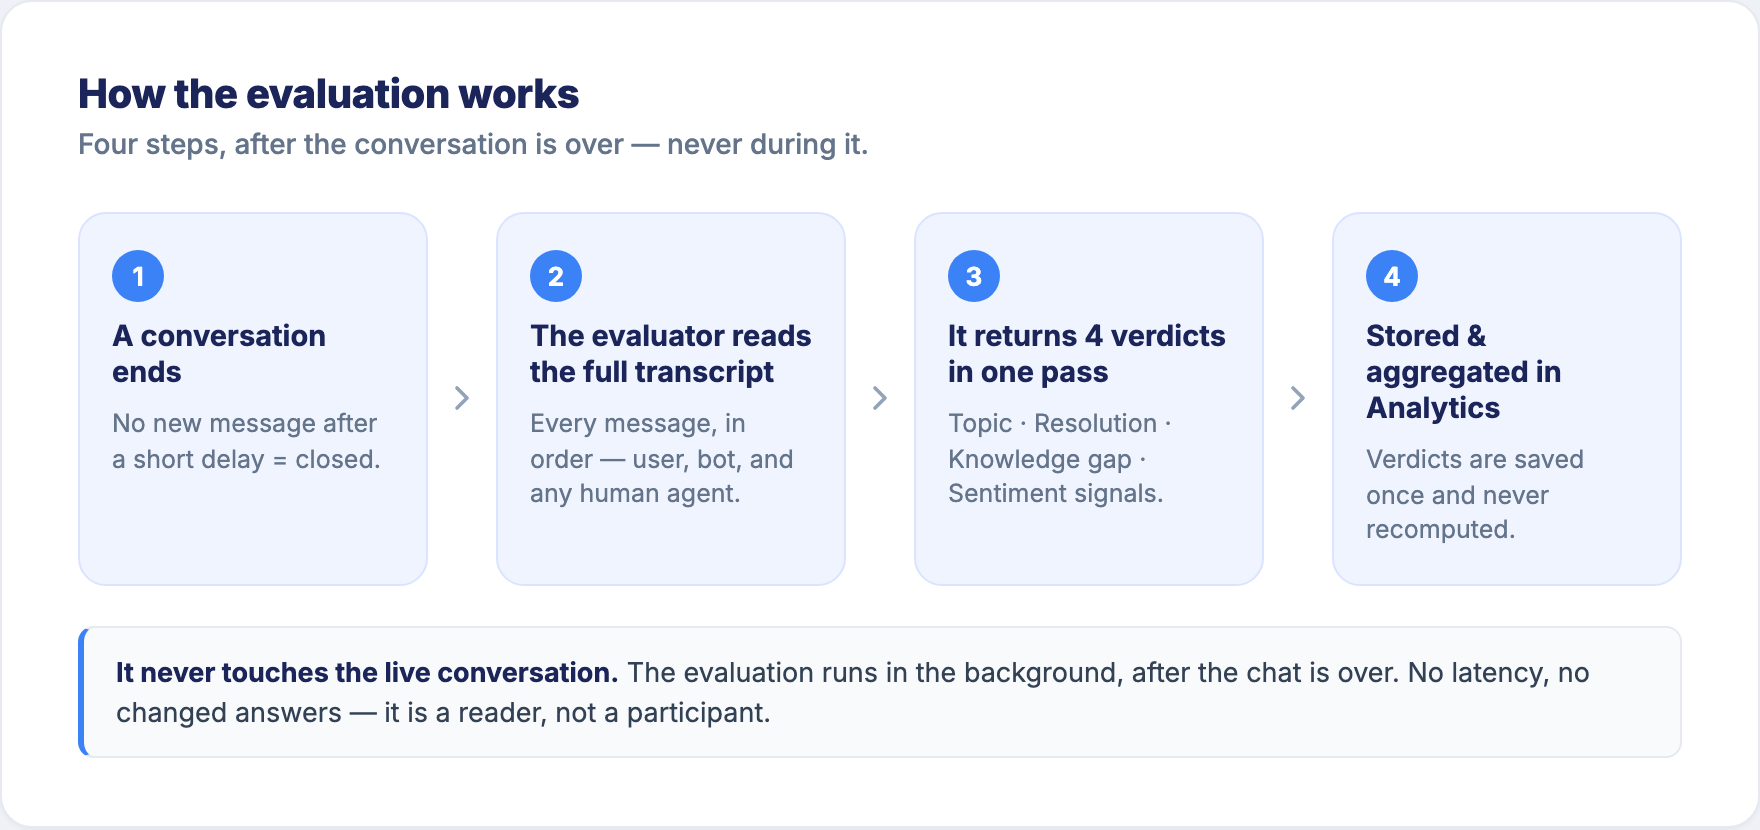
An AI evaluator now reads every conversation that ends — not a sample, not only the ones with a vote, not only the ones that used a Gen AI step. Scripted conversations are read too.
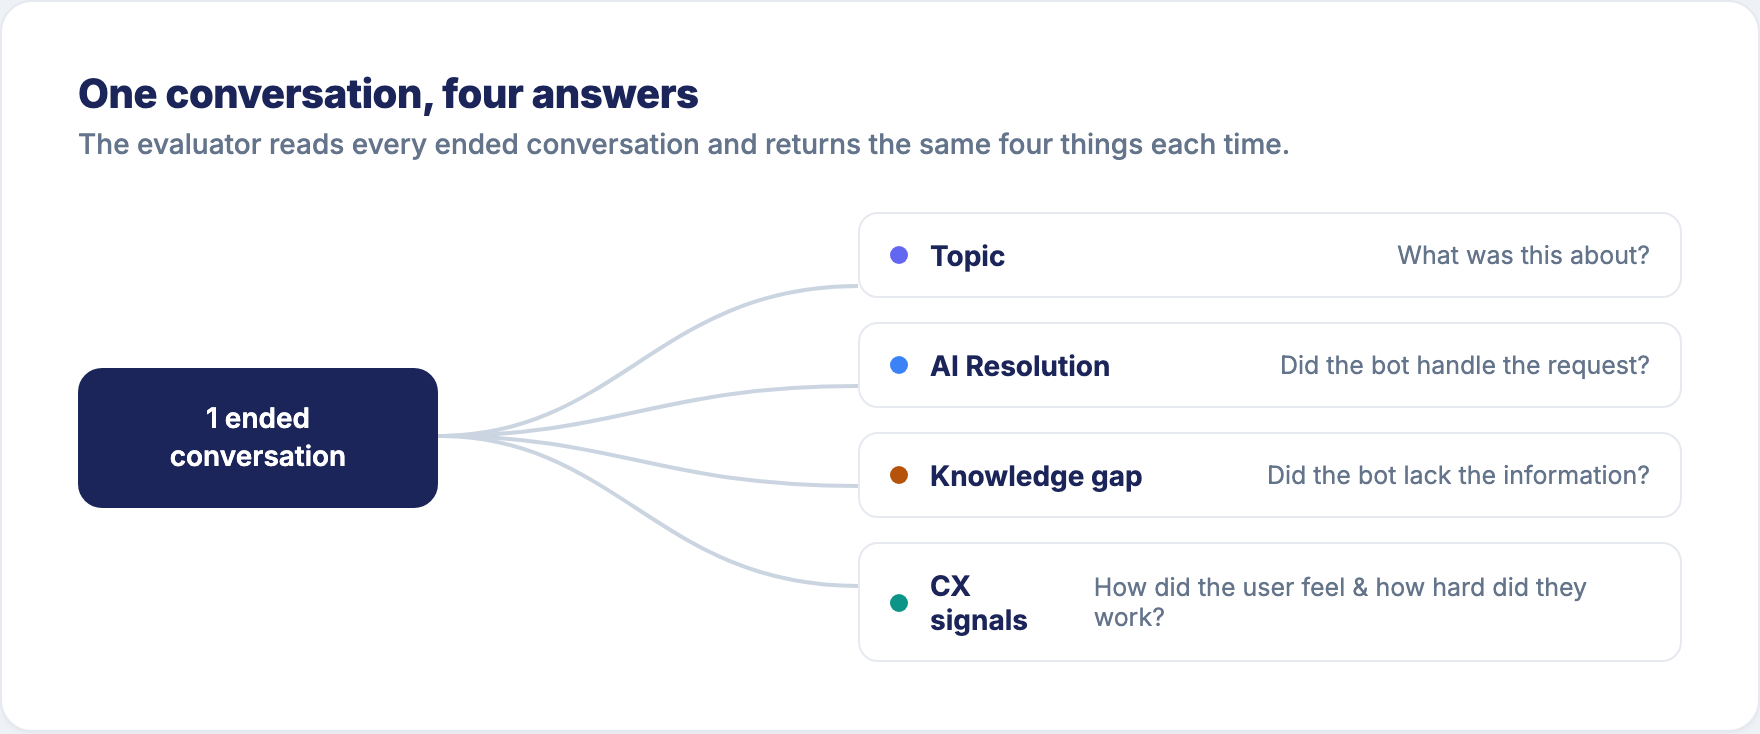
For each conversation it answers four questions — each one becomes a metric with its own page in this section.
The frame: measure first, improve second
Read this before you look at your first number, because it changes how you read it.
Quality measurement almost always follows the same pattern. Before you measure, you assume things are fine. The day you start measuring, it looks like everything is broken. Neither is true — you have simply opened your eyes.
A low number is not a failure. It is a starting point. You cannot improve what you cannot see. Step 1 is to see it. Step 2 is to fix it. This page and the metric pages are about step 1; the How-to guides are about step 2.
How the evaluation works
Two consequences worth knowing:
- Results are not instant. A conversation has to end before it can be read, and the reading happens in batches in the background. Expect your AI metrics to lag behind live traffic — they are a review of what happened, not a live feed.
- Verdicts are stable. Once a conversation has been evaluated, its verdict is stored and not recomputed. Your history does not shift under you.
Where you'll find it
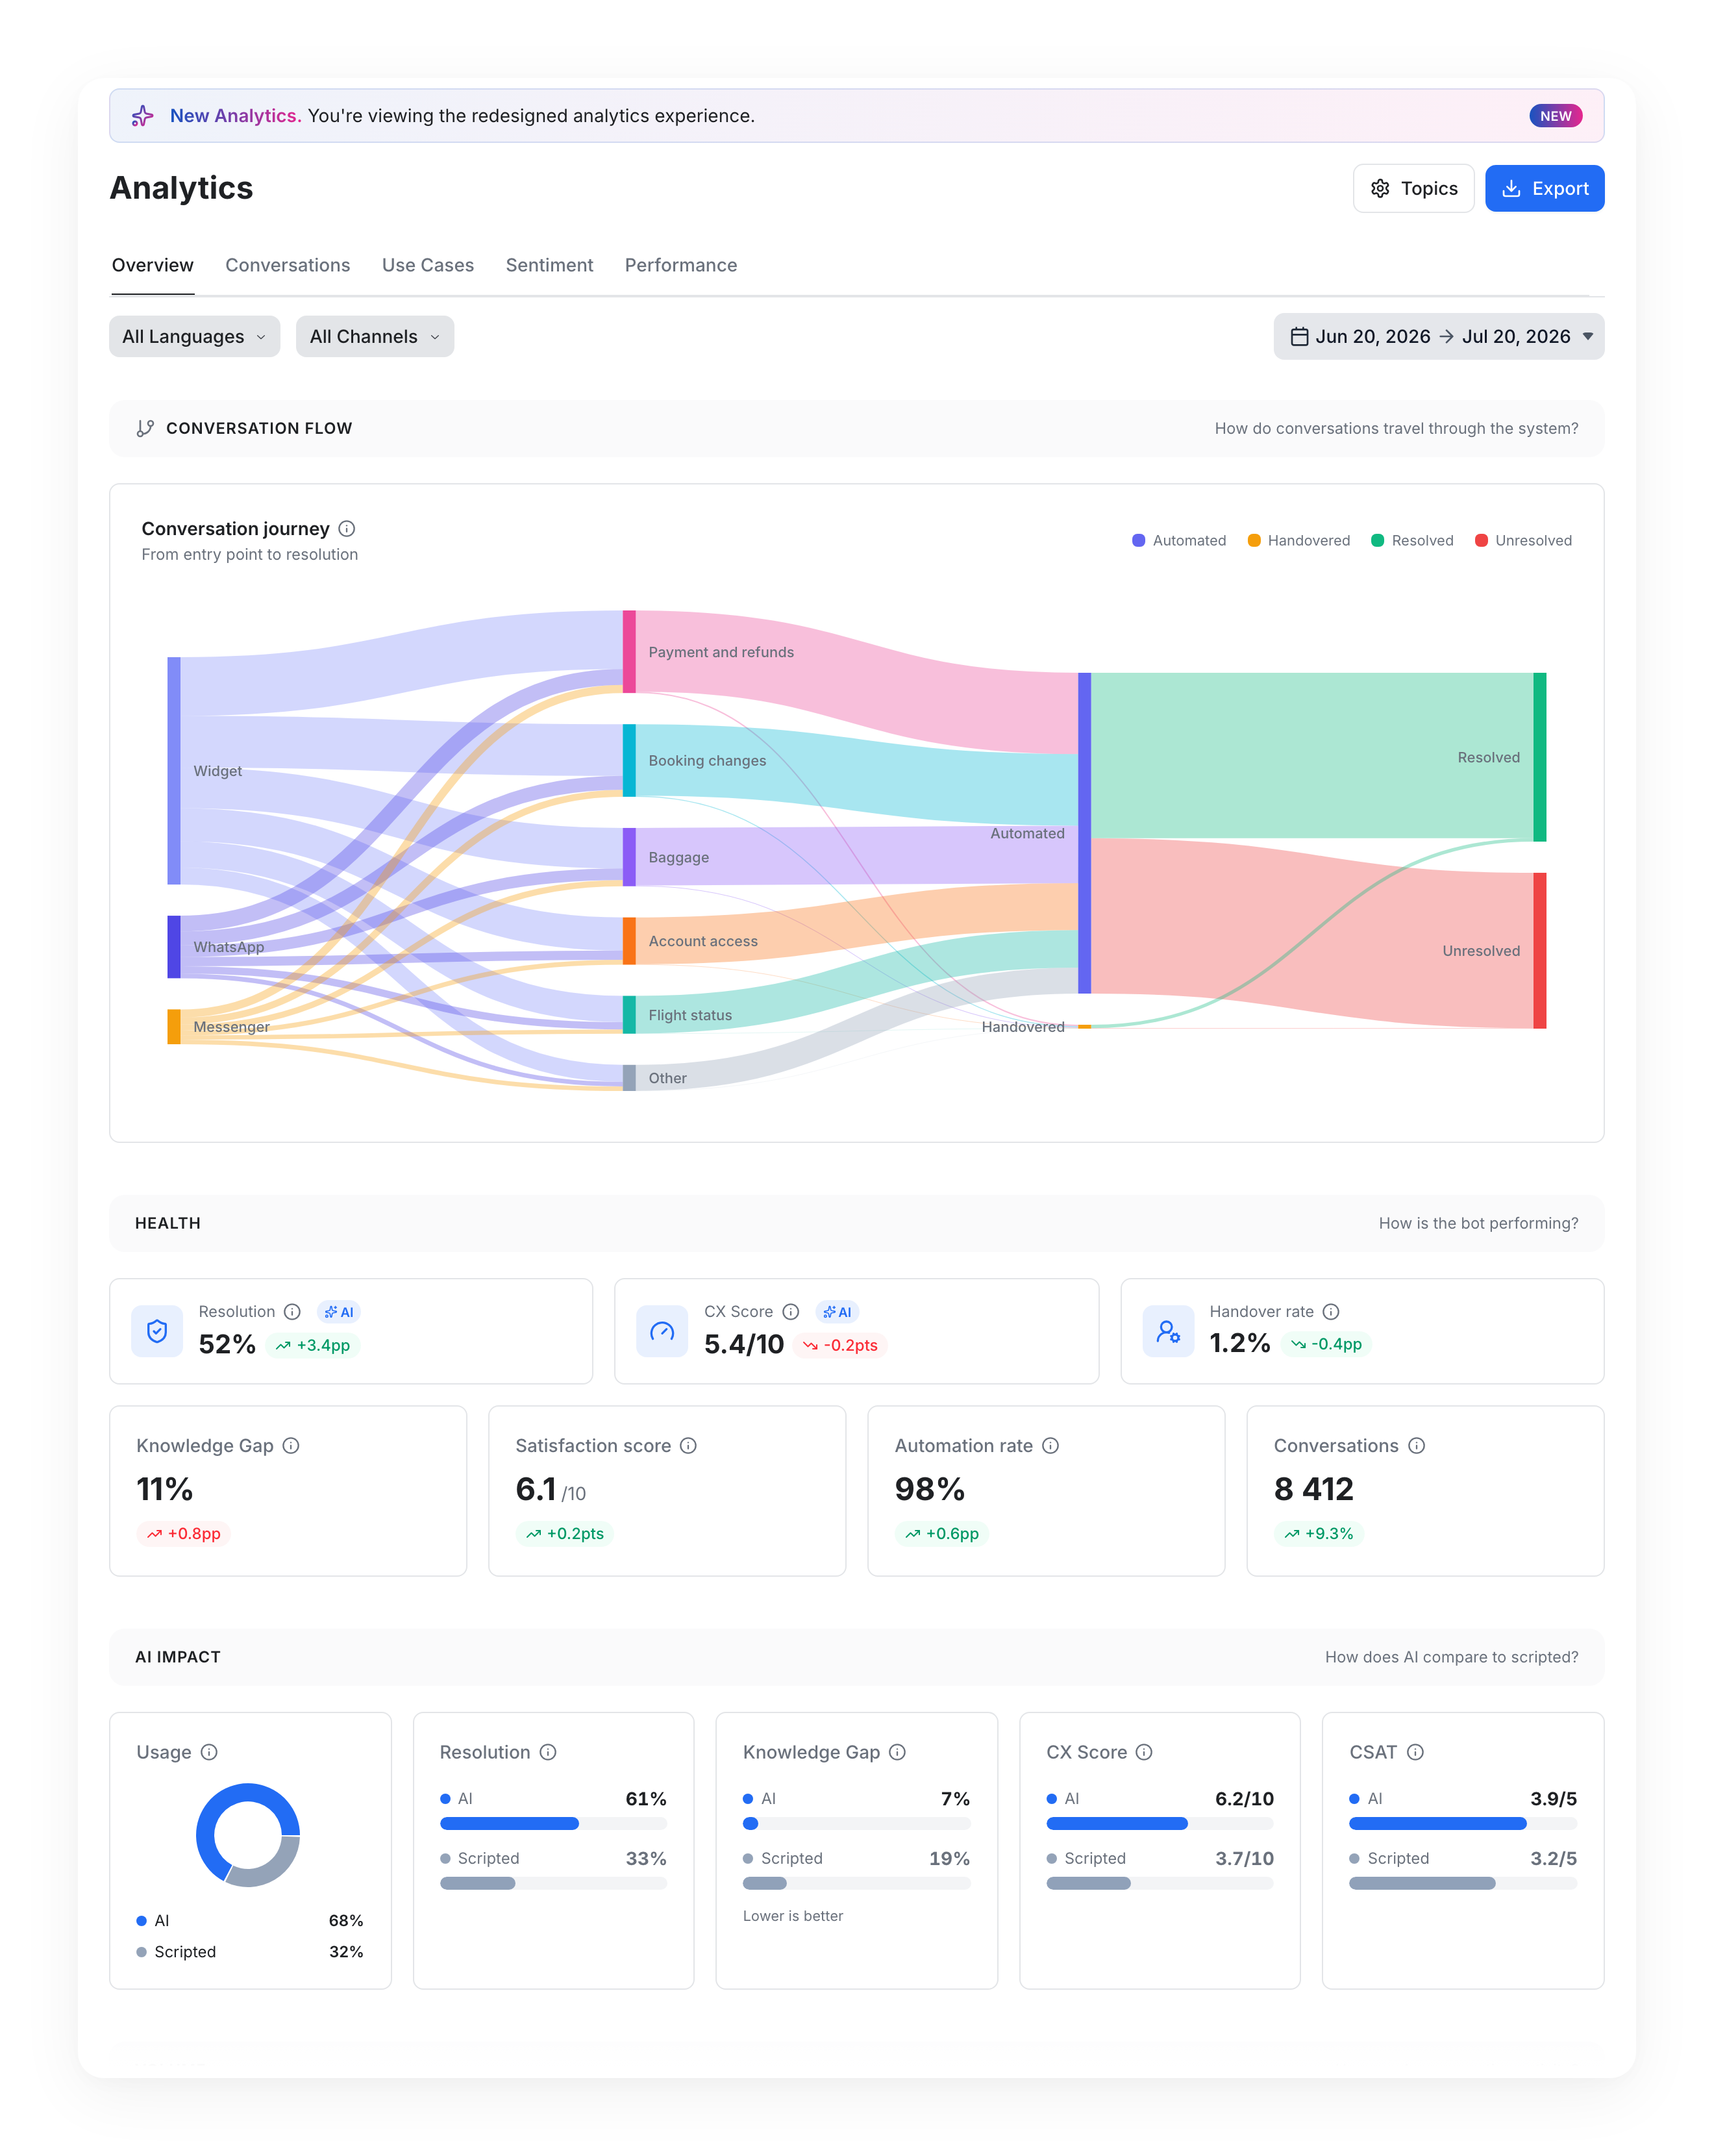
AI metrics appear across the five Analytics reports. Anything computed by the evaluator carries an AI badge. Each report has its own page:
| Report | What the AI metrics tell you there | Page |
|---|---|---|
| Overview | The headline: Resolution, CX Score, Knowledge Gap in Health; AI vs scripted in AI Impact; what users talk about in Topics | Overview report |
| Conversations | How users interact, who they are, when they're active, where they arrive from | Conversations report |
| Use Cases | Which use cases trigger, and how well they resolve | Use Cases report |
| Sentiment | Real user votes (CSAT, NPS) and Dissatisfaction Drivers — the topics that cause the most friction | Sentiment report |
| Performance | Trends over time, Unresolved Drivers, Knowledge Gaps by Topic, Article Performance | Performance report |
Global filters — Languages, Channels and the date range — apply to all of them. Every over-time chart additionally has its own Daily / Weekly / Monthly granularity control.
Put it to work
Measurement is step 1. These guides are step 2 — each one takes about an hour and is the point of the whole feature:
- How to improve your resolution — start here. Find your most expensive topic, read the conversations, fix one thing, re-measure.
- How to reduce your knowledge gaps — turn a high-gap topic into a Knowledge Base to-do list.
- How to improve your CX Score — attack effort and unresolved conversations where users have the worst time.
Coverage and limitations
Everything here is a real boundary of the feature. Read it before drawing conclusions.
What is covered
100% of ended conversations. Both AI and scripted. A conversation does not need to have touched a Gen AI step to be evaluated — fully scripted bots get the full analysis. Not a subset, not a sample — all of them.
A conversation must end to be evaluated. One that is still open hasn't been read yet.
The 1 January 2026 cutoff
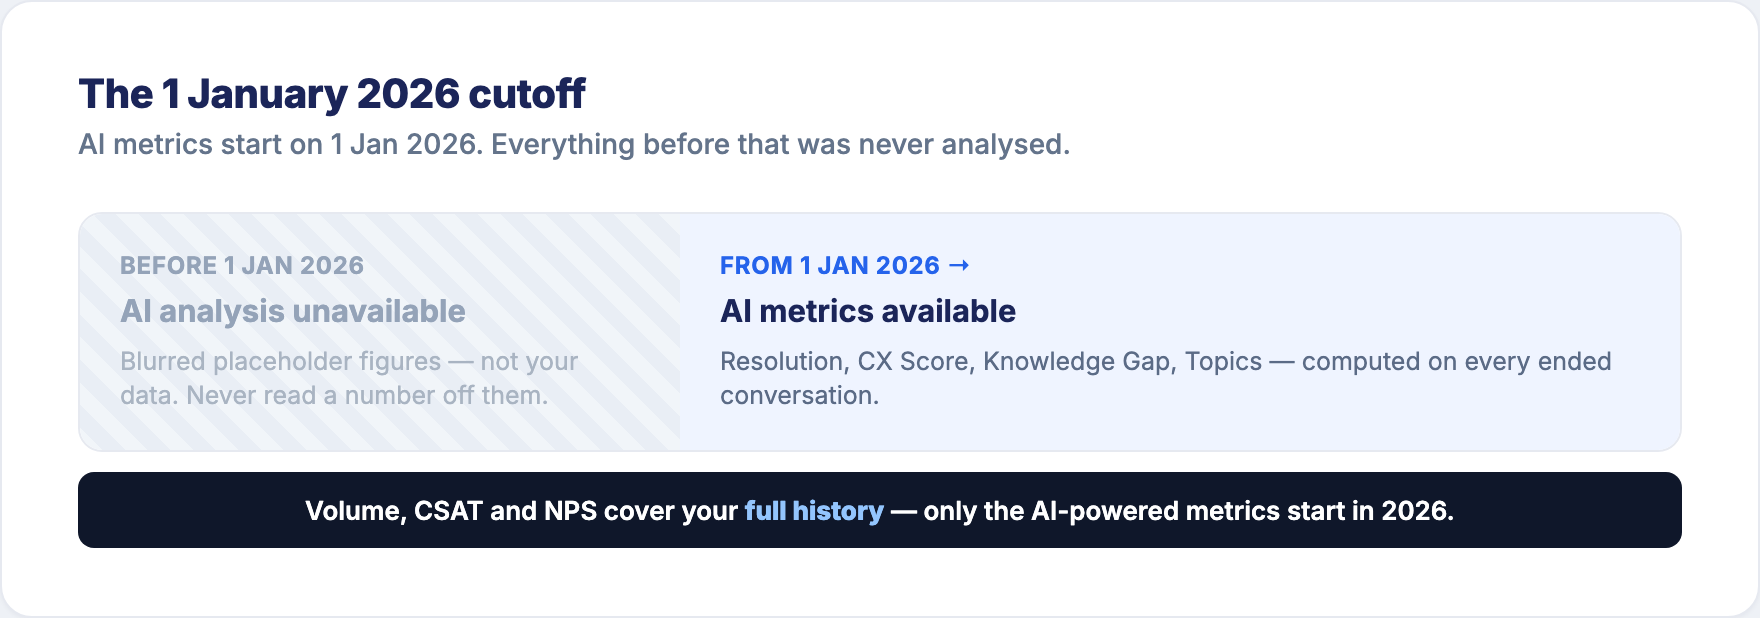
AI analysis starts on 1 January 2026
No AI metric exists for any conversation before 1 January 2026. The evaluation did not exist then, and conversations from before that date were not analysed retroactively.
If you select a date range that ends before 1 January 2026, AI-powered metrics show a blurred placeholder marked "AI analysis unavailable". The blurred figures are placeholders, not your data. They are there to show where the metric would appear — never read a number off them.
Your non-AI metrics — volume, conversations, handover, CSAT, and NPS if you have it enabled — cover your full history as usual. Only the AI-powered ones start in January 2026.
Careful with date ranges that straddle 1 January 2026
If your range starts before that date and ends after it, nothing is blurred — but the two families of metrics no longer cover the same thing. The AI metrics only cover the part of the range from 1 January 2026 onward, while volume and CSAT cover the whole range.
Concretely: a "last 12 months" range selected in July 2026 shows a conversation count spanning twelve months, next to a resolution rate computed on seven. Reading one against the other compares two different populations.
To read AI metrics safely, keep your start date on or after 1 January 2026.
(Unrelated, but often confused with the above: data collected before 1 June 2023 is only available through the Usage & Automation legacy dashboard. That's a separate, much older boundary.)
What the evaluator cannot do
- It can be wrong, in both directions. False positives and false negatives both exist. On a borderline conversation, a human might rule differently.
- We do not publish an accuracy figure, because we don't have one we'd stand behind. It would mean judging thousands of conversations by hand and comparing them one by one with the evaluator. We haven't built that, so we're not going to invent a number.
- It reads the transcript, and only the transcript. It doesn't know that your website was down that morning, that a flight got cancelled, or that the customer had already called twice. It judges what's in the conversation.
- It doesn't know your business rules. If your bot confidently states something false but plausible, the evaluator may well score it resolved. It measures whether the request was handled, not whether the answer was true.
- It will change. The criteria improve as we learn where they're wrong. Conversations already evaluated keep their original verdict, so a criteria change affects new conversations only — which means a long trend line can span more than one version of the criteria. Significant changes are announced in the product changelog.
- One topic per conversation. A conversation covering three subjects gets classified under one. At volume this averages out; on an individual transcript it can look reductive.
Use it as a compass, not a verdict
Don't put these numbers in a contract or a bonus target. Use them to find where to look — the handful of topics costing you the most, out of the thousands of conversations you will never read. They do that job well. Every number drills down to the real conversations behind it, so you can always check the evaluator's work.
Every verdict explains itself
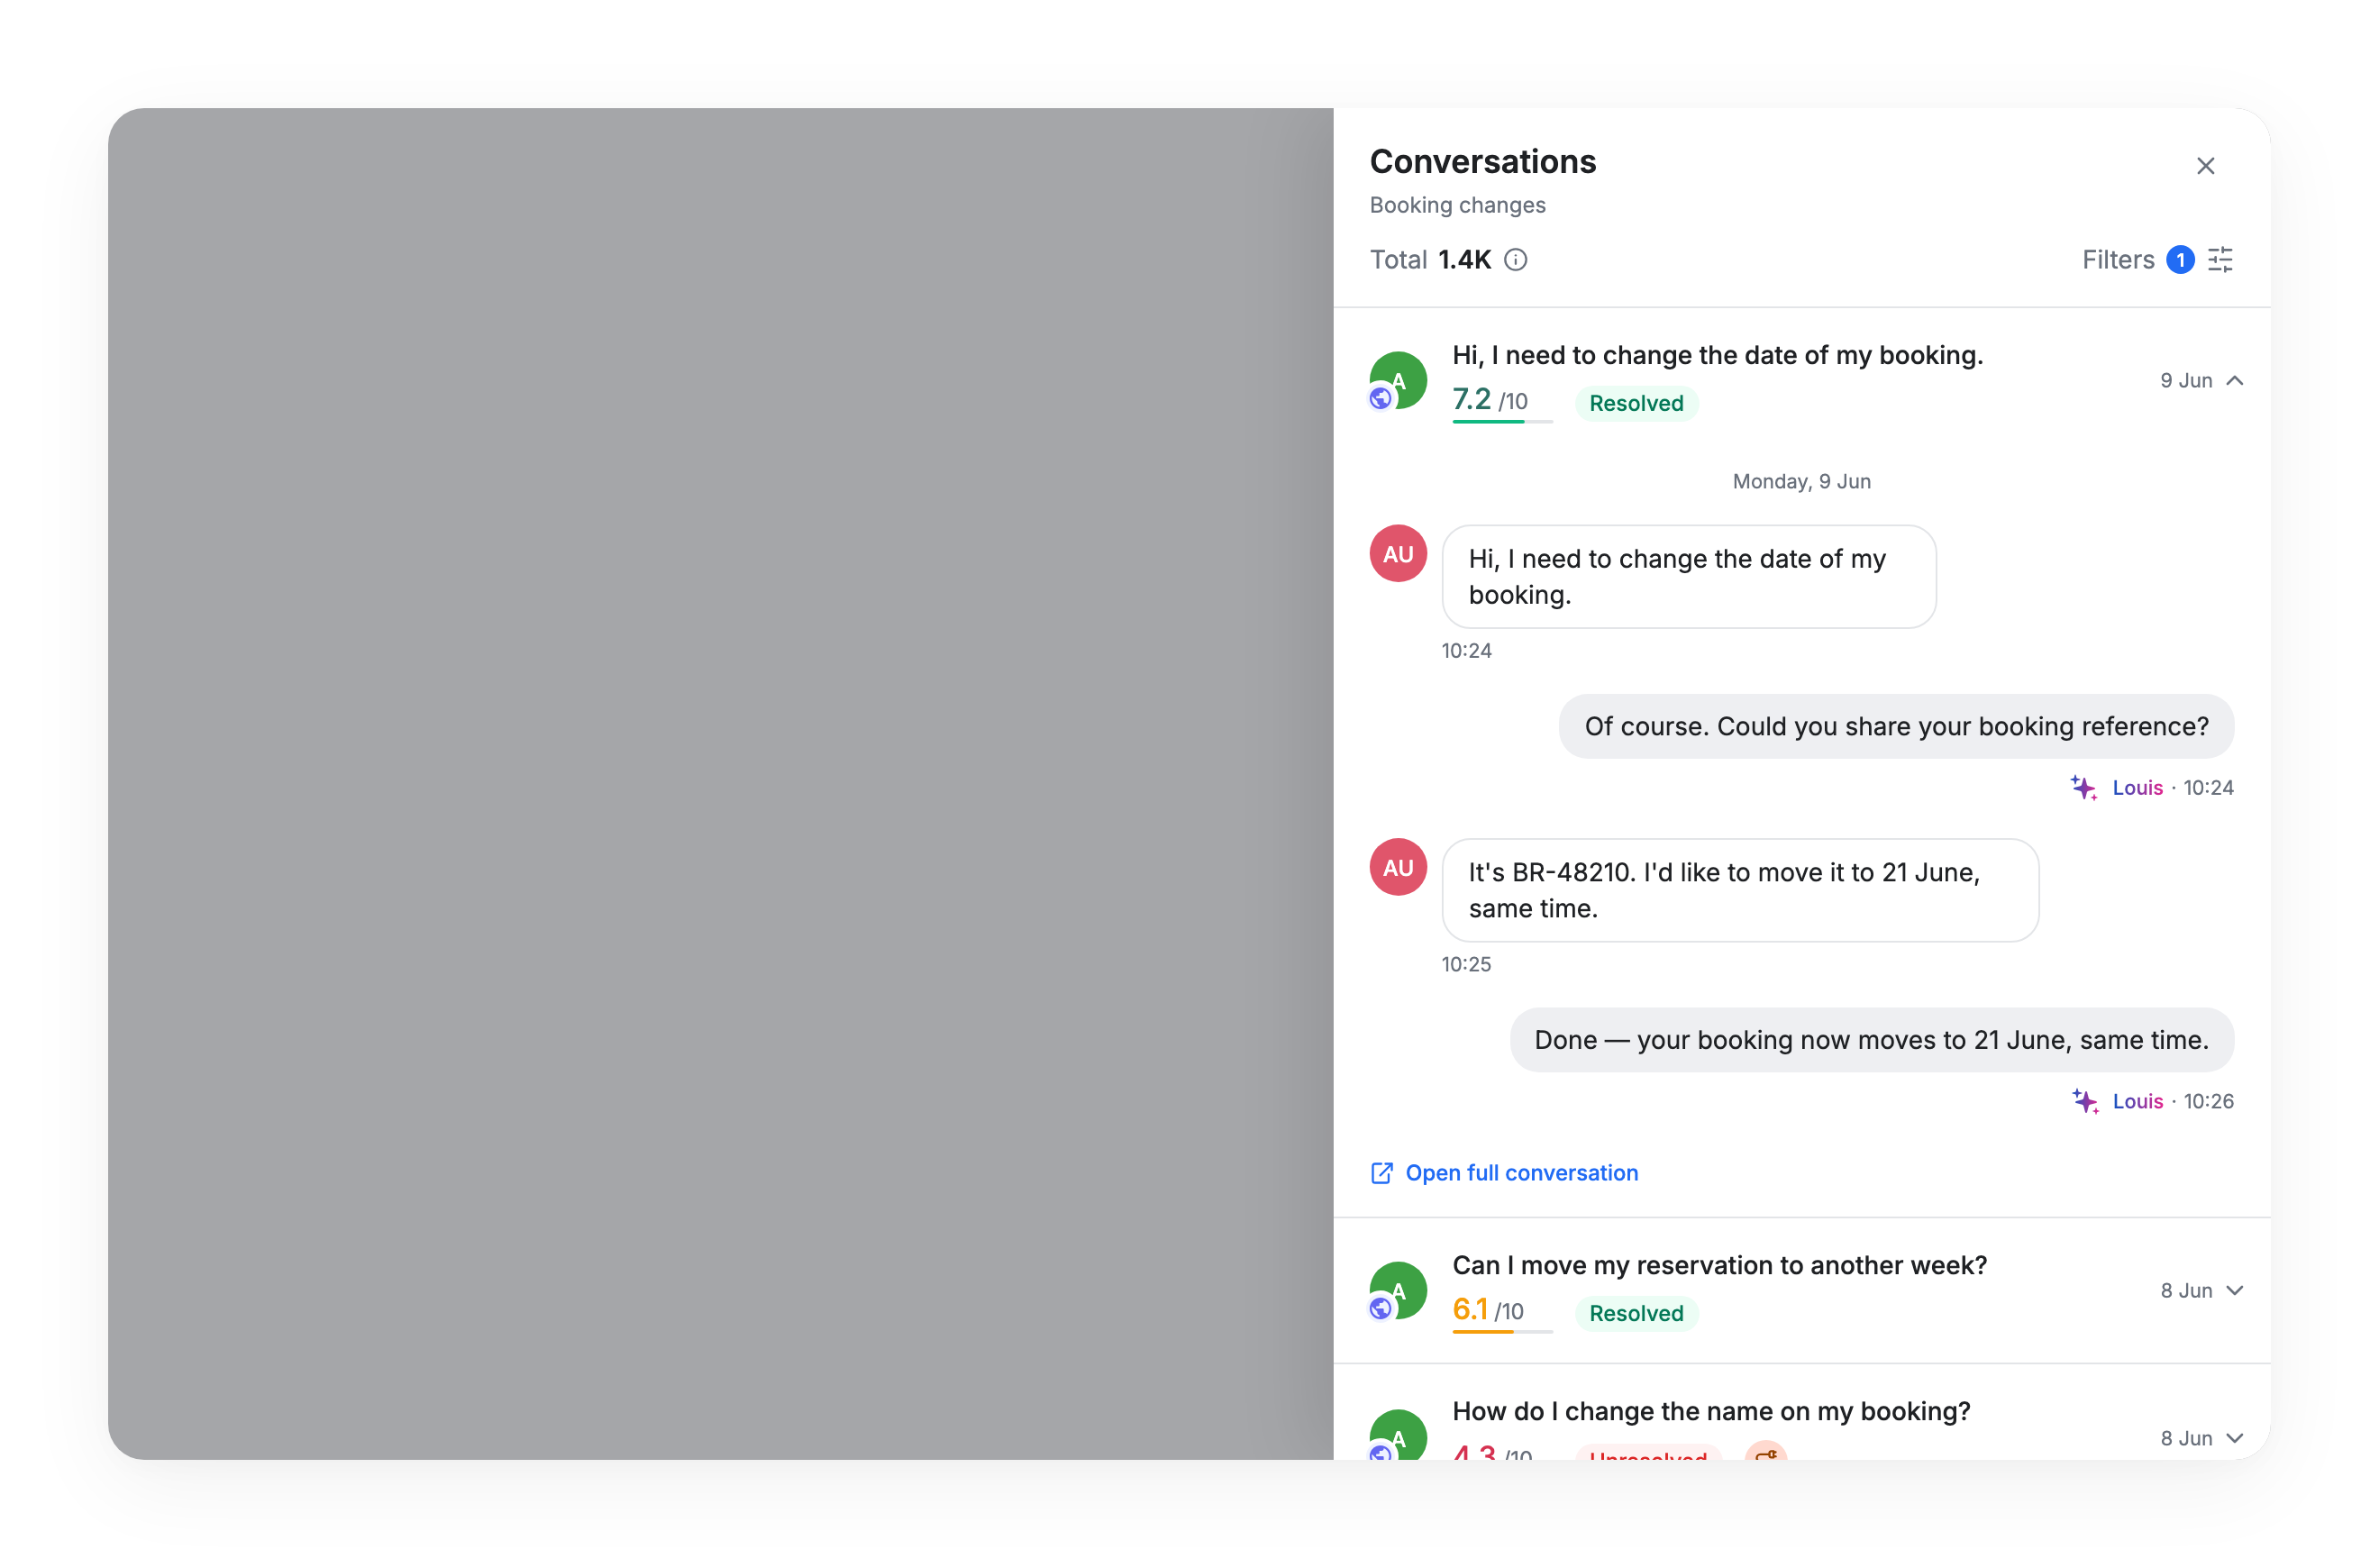
You never have to take a number on faith. Open the conversations behind any metric and each row carries its verdict as a tag — Resolved, Unresolved or Left early, plus Knowledge gap where it applies. Hover the tag to see what the outcome means and, when available, the evaluator's reasoning in one sentence. A Left early conversation is one the user left before there was anything to judge: it counts in neither Resolution nor CX Score.
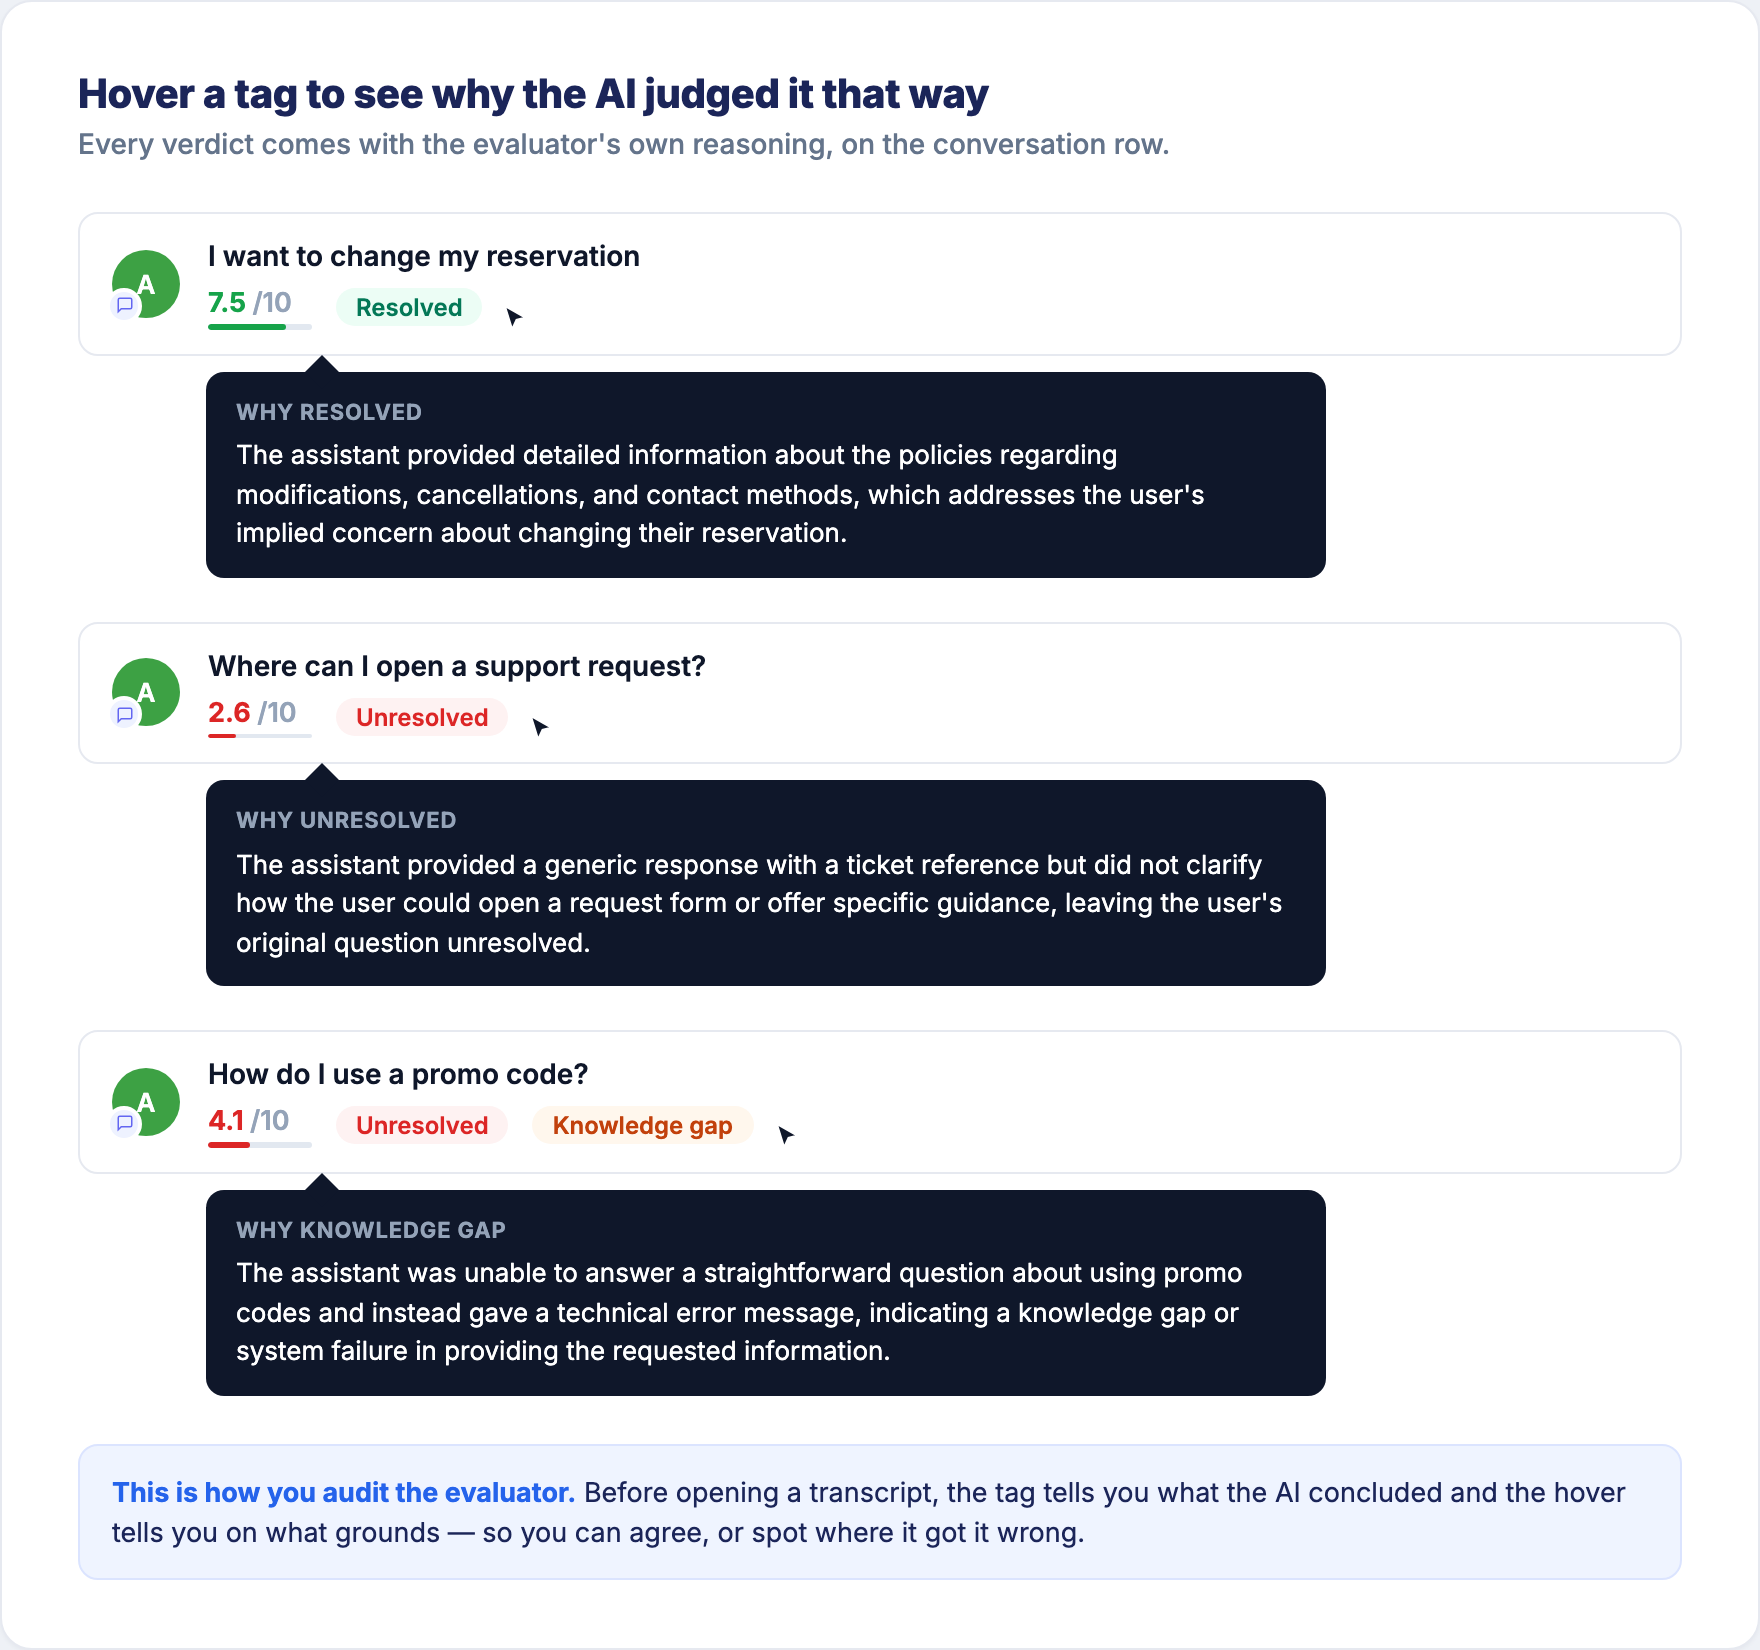
That is what makes the evaluator auditable rather than a black box: you see what it concluded, on what grounds, and you decide whether you agree.
Getting help
Your Customer Success Manager is there for this. Bring them a number you don't like.
They see these metrics across many bots. They know what a normal starting point looks like, which fixes typically move which metric, and — often the most useful thing — whether your number is a bot problem at all. Reading the first months of your data together is worth far more than reading it alone.
A low number is not a bad grade. It's a map. You now know where to dig, which is exactly what you didn't have last month.
Updated 16 days ago